Blutree Orthopedic Implants
Choosing an orthopedic implant manufacturer requires more than reviewing a polished website or a large product catalogue. Hospitals, distributors, and medical procurement teams need evidence of genuine production capability. The key question is: How to verify the real production scale of orthopedic implants makers without relying on untested claims?
A reliable assessment should connect factory experience, technical expertise, regulatory awareness, and documented performance. This article introduces seven practical ways to examine production scale, including facility visits, equipment checks, workforce evaluation, capacity records, quality systems, and supply history. Look for details that can be physically confirmed: machining centers running during a visit, labeled titanium components, controlled storage areas, and traceable inspection reports. Ask how many implants the manufacturer produces monthly, not only annually. Numbers should match staffing, equipment, and delivery records.
Small inconsistencies matter.
A factory may display advanced machinery, yet operate only a few lines. Another maker may have modest facilities but stronger process control and dependable output. Therefore, scale should not be judged by floor size alone. Experienced buyers should compare production data with certificates, audit findings, customer references, and shipment documentation. Independent verification also reduces the risk of confusing trading companies with actual manufacturers. The process is not always perfect, and available records may remain incomplete. Still, careful cross-checking creates a more realistic picture of manufacturing strength, operational reliability, and long-term supply capacity.
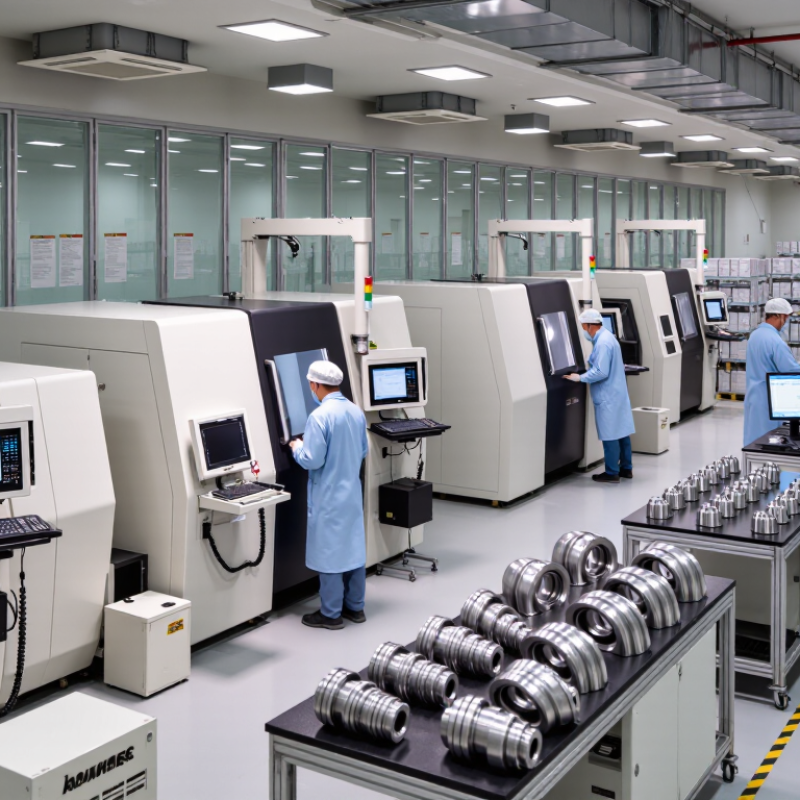
Verifying orthopedic implant production scale requires more than counting machines. Ask for installed capacity, validated capacity, and actual monthly output. These figures often differ. A factory may list 100,000 units annually, yet produce only 65,000 after maintenance, quality checks, and changeovers. Request production records for several representative months, not one unusually strong period.
OEE adds useful detail. Check availability, performance, and quality separately. A line running 20 hours daily may still lose capacity through short stoppages or slow cycles. Review downtime logs, scrap rates, rework records, and calibration reports. Also examine staffing levels, operator training, inspection equipment, and clean production areas. Numbers need context. They can be polished.
Three-year shipment data provides a stronger reality check. Compare annual units, product families, lot counts, delivery dates, rejected lots, and delayed orders. Reconcile shipment records with invoices, batch records, and inventory movements. Look for steady growth rather than one sudden peak. Ask how the facility handled a new implant design, urgent demand, or equipment failure. A dependable producer should explain these events with evidence.
A practical audit can include a live floor walk, machine utilization reports, quality-system records, and customer references where appropriate. Watch an actual changeover. Count completed trays. Review the difference between planned and shipped quantities. Some suppliers may not have perfect historical data. That is not automatically disqualifying, but unexplained gaps deserve careful questions. Scale is proven through consistent, traceable performance.
A credible orthopedic implant manufacturer should prove scale with records, not polished factory tours. Production equipment must match the claimed output. Check machine capacity, maintenance logs, calibration dates, and operator training. Compare these records with actual purchase orders and batch histories. Industry market reports estimate that global orthopedic device demand will grow at roughly 5% annually through the decade. That growth makes capacity claims worth testing carefully, not accepting quickly.
Cycle-time evidence should include loading, machining, cleaning, inspection, and release. Ask for timestamps from several recent lots. A repeated ten-minute cycle may look efficient, but it can exclude setup or rework time. ASTM F136 titanium alloy traceability requires clear control of chemistry, processing, and material identification. Review mill certificates, heat numbers, incoming inspection results, and links to finished-device records. ISO 13485 guidance also emphasizes documented traceability and risk-based process control. One missing link matters. A perfect spreadsheet can still hide a weak physical process.
Tips: Select three random implant lots and trace each heat number backward. Confirm supplier certificates directly against receiving records. Check whether ASTM F136 results come from qualified laboratories. Photograph labels, containers, and quarantine areas during an audit. Do not rely only on certificates. I have seen accurate documents paired with inconsistent floor labeling. That gap deserves a corrective-action record and a second review.
7 Best Ways to Verify Orthopedic Implant Production Scale?
Audit ISO 13485:2016 procedures and applicable FDA 21 CFR Part 820 records. Check whether document control matches actual production practices. Review device history records from several recent batches. Confirm material certificates, lot traceability, inspection results, and final release approvals. Look for evidence. Compare stated output with equipment capacity, shift schedules, and completed batch quantities. Inspect calibration labels on machining, cleaning, and testing equipment. Expired calibration can weaken otherwise impressive claims.
Interview production and quality personnel separately. Their answers should match written procedures and training records. Examine nonconformance reports, complaint files, corrective actions, and management review minutes. These records often reveal whether the factory handles volume consistently. Verify that supplier controls cover critical metals, coatings, packaging, and sterilization services. Request a controlled production walkthrough, not a prepared presentation. Watch how operators identify work orders and segregate rejected components. Small details matter.
A useful audit also tests traceability backward and forward. Select one implant lot and follow it to raw materials, operators, equipment, inspections, and shipment records. Then trace a raw material lot into finished devices. Missing links deserve attention. Do not guess. Production scale is not proven by floor space alone. I have seen clean facilities with weak records, and crowded facilities with disciplined systems. That contrast requires careful judgment. Auditors should record both strong evidence and unresolved gaps, including inconsistent signatures, late entries, or incomplete training updates.
Audit ISO 13485:2016 Systems and FDA 21 CFR Part 820 Records
The chart maps seven practical verification areas to the number of distinct requirement areas typically reviewed in an orthopedic implant production-scale audit. The references are based on ISO 13485:2016 quality-system topics and applicable FDA 21 CFR Part 820/QMSR requirements. These values represent checklist reference coverage, not company performance or production volume.
Reference basis: ISO 13485:2016 Clauses 4.2.5, 6.3, 6.4, 7.1, 7.4, 7.5, 7.6, 8.2 and 8.3; applicable FDA 21 CFR Part 820 requirements. Always verify the regulatory version and applicable device classification before an audit.
To verify orthopedic implant production scale, begin with the UDI record in FDA’s GUDID database. Search the device identifier, model description, sterile status, and packaging details. Confirm that the listed information matches the implant, label, and supplier documents you received. Small mismatches matter.
GUDID mainly describes device identifiers, not monthly factory output. It usually will not prove how many implants were made in a specific lot. For that, request lot numbers, manufacturing dates, batch-release records, and shipment histories. Compare the production pattern with the UDI information. A broad product family with many package configurations may suggest operational depth, but it does not guarantee capacity.
Check each lot against FDA recall notices and safety communications. Record the lot number exactly, including letters, spaces, and leading zeros. Then compare the result with supplier-provided traceability records. A recalled lot may reveal weaknesses in inspection, labeling, or distribution controls. No recall match is reassuring, but it is not proof of superior production.
Use several records.
One practical warning: public databases can contain delayed updates, incomplete fields, or naming differences. I have seen teams treat a searchable UDI entry as proof of factory scale. That assumption is too simple. Ask for dated evidence, inspect consistency across records, and document every unresolved discrepancy before approving a supplier.
Verifying orthopedic implant production scale starts with the cleanroom, not the brochure. ISO 14644-1:2015 classifies air cleanliness by particle concentration. For ISO Class 8, the limit is 3,520,000 particles of at least 0.5 micrometers per cubic meter. Request recent particle-count maps, recovery tests, pressure logs, and calibration records. A single certificate proves little. ISO 14644-2 also expects a risk-based monitoring plan, so check sampling frequency and failed-test responses.
Staffing reveals whether capacity is real. Compare approved headcount with actual shifts, overtime, training records, and qualified operators per production cell. The U.S. Bureau of Labor Statistics reported more than 600,000 industrial engineering and production-related roles across relevant manufacturing categories in 2023, but broad labor statistics cannot confirm implant expertise. Ask for anonymized competency matrices and observe gowning, inspection, and traceability practices. Numbers can mislead.
Supplier depth matters equally. The WHO Global Atlas of Medical Devices reports more than two million medical device types worldwide, illustrating the complexity behind component control. Review critical-material sources, backup suppliers, incoming inspection data, and change-notification procedures. ISO 13485-based controls should link each supplier to risk management and device history records. Ask for evidence. A supplier list is not a capacity plan. One uncomfortable weakness remains common: factories may present maximum theoretical output instead of validated monthly output. Reconcile purchase orders, equipment utilization, scrap rates, and shipment records. Some records will be incomplete. That gap deserves investigation, not polite acceptance.
| No. | Verification Dimension | What to Verify | Reference Data or Acceptance Criterion | Required Evidence | Scale-Risk Signal |
|---|---|---|---|---|---|
| 1 | Cleanroom Classification | Confirm that manufacturing and packaging areas are classified using ISO 14644-1 particle concentration limits. |
At ≥0.5 μm and ≥5.0 μm, the maximum permitted particles per m³ are:
ISO Class 5: 3,520 / 29 ISO Class 6: 35,200 / 293 ISO Class 7: 352,000 / 2,930 ISO Class 8: 3,520,000 / 29,300 |
Current classification report, sampling plan, particle-counter calibration certificate, room layout, and test date. | Classification is outdated, incomplete, performed only in an empty room, or does not cover critical processing and packaging zones. |
| 2 | Routine Environmental Monitoring | Check whether the facility continuously controls airborne particles and investigates excursions under ISO 14644-2 principles. | Monitoring locations, alert limits, action limits, sampling frequency, alarm response, trend reviews, and corrective-action closure must be defined in controlled procedures. | Environmental-monitoring records for at least three recent production months, excursion logs, calibration records, and corrective-action reports. | Only one-time qualification data is available, trends are not reviewed, or repeated alerts remain unresolved. |
| 3 | Airflow, Pressure, and Recovery Capacity | Verify that airflow direction, room pressure differentials, air changes, and recovery performance support the intended production volume. | ISO 14644-3 test methods should be applied where relevant. Pressure limits, airflow patterns, recovery time, temperature, and relative humidity must be documented in the facility’s qualified design basis. | Airflow-visualization study, pressure logs, HEPA-filter integrity tests, recovery test, HVAC qualification, and preventive-maintenance records. | Pressure reversal during normal operations, poor recovery after door opening, insufficient HVAC redundancy, or frequent filter failures. |
| 4 | Qualified Staffing and Shift Coverage | Assess whether qualified personnel are available for machining, cleaning, inspection, quality control, maintenance, and release activities across all shifts. | Every critical operation should have trained primary and backup personnel. Training matrices should show current qualification before independent work; staffing plans should cover planned output, absences, and peak demand. | Organization chart, shift roster, competency matrix, training records, authorization lists, overtime records, and turnover or vacancy data. | One-person dependency, unqualified temporary labor in critical steps, excessive overtime, or no qualified backup for inspection and release. |
| 5 | Equipment and Capacity Verification | Compare installed equipment, validated process windows, maintenance status, and available production hours with the requested implant volume. | Capacity calculations should include cycle time, setup time, inspection time, changeover, planned downtime, scrap or rework, preventive maintenance, and realistic utilization rather than nameplate capacity alone. | Asset register, calibration certificates, validation protocols, preventive-maintenance history, production schedule, OEE or utilization reports, and capacity model. | Quoted capacity depends on unvalidated overtime, uninstalled equipment, unavailable inspection assets, or utilization assumptions near 100%. |
| 6 | Supplier and Subcontractor Resilience | Verify the availability and control of critical materials, special processes, sterilization-related services, packaging components, and outsourced testing. | Critical suppliers should be approved, risk-ranked, periodically evaluated, and covered by documented specifications, change notification, traceability, and contingency plans. Dual sourcing is preferred where technically and commercially feasible. | Approved-supplier list, supplier audits, quality agreements, certificates of analysis, incoming-inspection records, lead-time data, change-control notices, and business-continuity plans. | Single-source dependency, long or unstable lead times, uncontrolled subcontracting, missing material traceability, or no qualified alternative. |
| 7 | Quality and Regulatory Readiness | Confirm that higher production volume will not weaken traceability, process validation, nonconformance control, or final product release. | Each implant should be traceable to material lot, equipment, operator, process record, inspection result, and release decision. Process changes and capacity expansions should be evaluated through formal change control. | Device-history records, lot-traceability exercise, nonconformance and CAPA trends, internal-audit reports, validation summaries, complaint data, and release procedures. | Incomplete records, delayed release, rising rework, repeated CAPA issues, unresolved audit findings, or capacity expansion without requalification. |
Ask for installed, validated, and actual monthly capacity. These figures may differ. Review several representative months. One strong month proves little.
Machines do not equal finished implants. Maintenance, changeovers, inspections, and staffing reduce output. A crowded floor can still perform poorly.
Request batch quantities, production dates, downtime logs, scrap records, and rework reports. Compare planned output with completed and shipped quantities. Gaps need explanation.
Review availability, performance, and quality separately. A line may run 20 hours yet lose capacity through short stoppages. Check cycle speeds, rejected units, calibration records, and equipment utilization.
Compare annual units, product families, lot counts, delivery dates, rejected lots, and delayed orders. Look for steady performance, not one sudden peak. Reconcile shipments with invoices and inventory records.
Review device history records, material certificates, inspection results, release approvals, and calibration labels. Check several recent batches. Expired calibration weakens confidence.
Select one finished lot and trace it backward to materials, operators, equipment, inspections, and shipment records. Then trace a material lot forward. Missing links matter.
Watch a real changeover, identify work orders, count completed trays, and observe rejected-component segregation. Avoid a prepared presentation. Small details often expose weak controls.
Not always. Some records may be imperfect. Unexplained gaps, late entries, inconsistent signatures, and incomplete training updates deserve careful questions. My judgment could be incomplete, so evidence matters more than appearance.
How to verify the real production scale of orthopedic implants makers requires more than reviewing stated annual capacity. Start by comparing installed capacity with OEE, equipment availability, verified cycle times, and shipment records from the past three years. Confirm that production data is supported by appropriate machinery, qualified operators, and complete traceability for materials such as ASTM F136 titanium. This helps distinguish genuine manufacturing capability from theoretical output.
A reliable assessment should also examine the manufacturer’s ISO 13485:2016 quality system and FDA 21 CFR Part 820 records, including production, inspection, corrective action, and complaint documentation. Cross-check UDI, lot, and recall information through FDA GUDID where applicable. Finally, validate cleanroom classifications under ISO 14644, staffing levels, maintenance programs, and critical supplier controls. Reviewing these factors together provides a practical, evidence-based picture of production scale, consistency, regulatory readiness, and long-term supply reliability.